


Averages

Watch this as a video
From a list

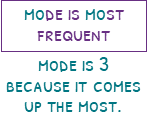
If we are given the list of numbers 6, 3, 2, 3 and 1, we summarise this list using averages.
The mode is the number, or thing, that comes up the most. In our list, there are a couple of 3s, so the mode is 3. The mode is great for situations when you want to find the most popular of something. Mode is also the only average that works with words as well as numbers.
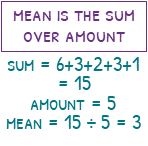
The mean is found by adding up the numbers then dividing by the amount of numbers. 6 + 3 + 2 + 3 + 1 = 15. there are five numbers so we will do 15 divided by 5 which gives us the mean as 3. The mean is so popular in real-life, that when people say the word average, they are probably talking about the mean. The great thing about the mean is that it includes every number in the calculation. If we added a 20 to the list, the mean would increase, yet the mode would stay the same.
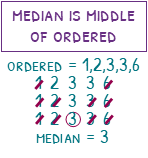
The median is known as the middle number. Be careful though, the numbers must be in order of size. We normally write the numbers from smallest to largest, but we could write them from largest to smallest if we were feeling rebellious. When we have ordered them (1, 2, 3, 3, 6) we will then cross out the smallest and largest (the 1 and 6). We will continue to cross out the smallest and largest until we are left with one number. Our median is 3.
The median is fantastic at getting rid of extreme values. Imagine you are finding the average wage in a five-person company. Four people make £20,000 a year, but the boss makes £10,000,000. Would it be fair to say the average wage is over 2 million pounds? The median would cross out the boss at step 1, and would give a much more representative average of £20,000.
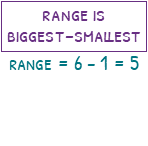
The range is not an average. Averages have a goal of writing a single number that represents lots of values. The goal of the range is to give a single value that represents the spread of the data. It does this by subtracting the smallest value from the largest. The largest value in our list is 6 and the smallest is 1, so the range is 6 – 1 which is 5. The smaller the range, the more consistent the data is. Imagine you are playing a computer game. If your score has a range of 2, that means your best game was very similar to your worst game.
From a list (more tricky)

If our numbers are now 2, 3, 2 and 3, the averages become a bit more tricky to calculate.
The mode is now conflicted between 2 and 3, since there are two of each. In this case, you could say there is no mode, or you could say that there are two modes. When you have two modes, we call this bimodal.

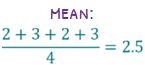
The mean will be the sum of the numbers (10) divided by the amount of numbers (4). This will give the mean as the decimal 2.5. Don’t worry though, the mean is often a decimal.
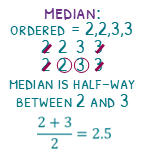
The median seems like it will be straight forward. We order the numbers, 2, 2, 3, 3, then cross out the smallest and largest, the 2 and the 3. Next we cross out the next two… oh… we have crossed out all the numbers. When we are left with two numbers in the middle, we add them together and divide by two. 2 + 3 is 5, divided by two gives us 2.5.
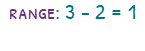
The range will be the largest, 3, take away the smallest, 2. The range is 1.
Try our paper on this
Averages problems
Most problems involving averages involve us working backwards from the averages to find the raw data.
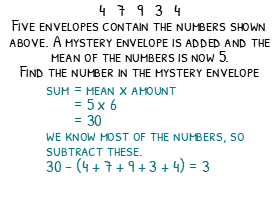
Imagine we have five envelopes which contain the numbers 4, 7, 9, 3 and 4. A mystery envelope is added and the mean of the numbers is now 5. We must now find the number in the mystery envelope.
We calculated the mean earlier by the sum of numbers over the amount. We can rearrange this to the sum of numbers = the mean times the amount. The mean is 5 and the amount is 6, 5 x 6 = 30. We now know the numbers add up to 30. We can now take away the numbers we know to leave the mystery number. 30 – (4 + 7 + 9 + 3 + 4) will give us 3. The mystery envelope contains the number 3.
My favourite averages question involved us not knowing any of the numbers.
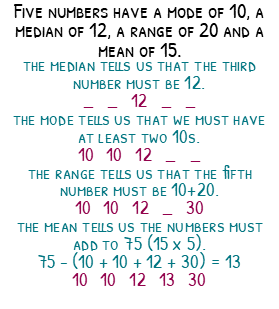
Five numbers have a mode of 10, a median of 12, a range of 20 and a mean of 15.
To figure out what the numbers are, we have to think about which average will give us our first number. We know that the median will always be the middle number, so if we write the numbers in order of size then the third number must be 12.
_ _ 12 _ _
The mode must be in this list at least twice, but we know there are only two numbers less than 12, because the median number must be the third in the list. We therefore must have two 10s
10 10 12 _ _
The range is the distance from the smallest number to the largest. We know the smallest number is 10, so adding on the range, the largest must be 10 + 20 which is 30.
10 10 12 _ 30
In the last problem, we found that the sum of the numbers is the mean times the amount. The mean is 15 and the amount is 5, so the sum is 15 x 5 which is 75. Take away the numbers we know, 75 – (10 + 10 + 12 + 30) and the final number must be 13.
10 10 12 13 30
From a frequency table
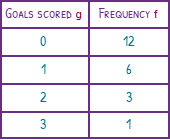
When we have a lot of data, it is often much easier to put it into a frequency table. You could remove all the data from the table back to a list if you wish, but there are a few methods to find the averages when they are in a table that would be much quicker.
The mode is simply the number that came up the most. Look for the largest frequency. On the table, this would be 12. This 12 shows us that 0 goals came up 12 times. If we were to write this as a list, we would write 0, 12 times. The mode is 0 since this has the highest frequency.

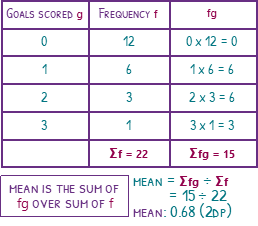
To find the mean, we need to first calculate the sum of the numbers. We can’t simply add the 0, 1, 2 and 3 because if you look at the 2, for example, the frequency is 3, so this number would come up three times if we wrote this as a list. We must, therefore, add a column on to our table to find the sums of each number. 0 has a frequency of 12, so there are 12 0’s on the list. These would add up to 0. 1 has a frequency of 6, so there are 6 1’s on the list. These would add up to 6. 2 has a frequency of 3, so there are 3 2’s on the list. These would add up to 6. 3 has a frequency of 1, so there is a single 3 on the list. To find the total sum (∑fg) we can add these all together. 0 + 6 + 6 + 3, giving us a sum of 15.
To find the amount, we add up the frequencies. 12 + 6 + 3 + 1 gives us 22. The mean is the sum over the amount, so 15 over 22, which is 0.68 to two decimal places.
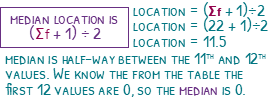
The median can be a bit tricky when working with data in a table. There is a nice little formula you can use to help you. If you add one to the frequency, then halve it, it will tell you where the median is. For our data, we have 22 values, add one will give us 23, then halve is will give us 11.5. Because we have a decimal, we are looking at the 11th and 12th values. Looking at the table, the first twelve values are 0, so the 11th and 12th must be too. So the median is 0.
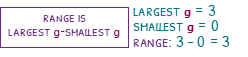
The range is the largest – smallest value. Be careful not to accidently look at the frequencies. The range doesn’t care how many there are of each value, it just cares about which is the biggest and smallest. The biggest is 3 and smallest is 0, so the range is 3 – 0, which is 3.
From a grouped frequency table
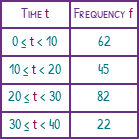
As soon as we group data, it is impossible for us to write out the data as a list any more. Our first group for this table is 0 ≤ t < 10, but perhaps all the values are 4. Maybe we have some 1s and the rest are 0s. Who knows!
We should also briefly discuss the groups. 0 ≤ t < 10 means all the data in the group is between 0 and 10. It can include 0, but cannot include 10. So 9.9 would go in this group, but 10 would not.
We are no longer interested in finding the mode, since we no longer know what the exact data is. We will now be looking for the modal class. Class is a fancy way of saying group. We are looking at which group came up the most (has the highest frequency). 20 ≤ t < 30 has a frequency of 82, which is more than the other groups, so the modal class is 20 ≤ t < 30.

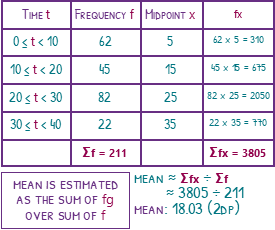
We are also unable to find the mean. Instead, we estimate the mean. This doesn’t mean we take a guess, it just means that we have to make a few assumptions. For the frequency table, we multiplied the number of goals by the frequency to find the sum. For this grouped table we cannot multiply the time by the frequency, because the time is written as a group. We need to find a number that can represent that group. It would be unfair to assume the numbers in the first group are all zeros, since they are probably all more than 0. A better estimate of all the values is the half-way point, or midpoint. If the midpoint isn’t obvious for a group, we can add the smallest and largest numbers together then halve it. 0 + 10 is 10, then halve that is 5. So we will assume all the numbers in the first group are 5. We can then do 5 x 62 to find the sum of the first group as 310. We will then do this for the other groups to find the ∑fx = 3805
When we have filled out the table, we will do the same steps we did with the frequency table. We will find the amount by adding up the frequencies. 62 + 45 + 82 + 22 gives us 211. The mean is the sum over the amount, so 3805 over 211, which is 18.03 to two decimal places.
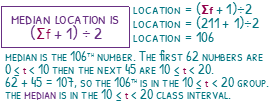
We cannot find the median, but you will normally be asked to find the group, or class interval, that contains the median. Using our location formula, we will do 211 + 1, giving us 212, then divide by 2, giving us the median as the 106th value. We know the first 62 values are in the first group. Adding 62 and 45 gives us 107, meaning the 107th value is the last one in the second group. This means the 106th value is in the second group. So the median is in the group 10 ≤ t < 20.
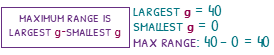
You are able to find the range, but you need to know that you will be finding the largest possible range, or smallest possible range. The maximum range is the largest possible value – the smallest possible value. The largest possible value will be 40 (I know that it should be 39.9999… but this is 40, so choose 40!) and the smallest possible value will be 0. The maximum range will be 40 – 0 which is 40.
The minimum range will use the smallest that the largest number could be, which is 30, because the 22 values in the last group could have all been 30. The largest possible smallest number would be 10. So the minimum range will be 30 – 10 which is 20.
Try our paper on this
Download Averages Notes
(Ultimate subscription required)
